
Battery Capacity vs Battery Life: Why mAh Tells Only Half the Story
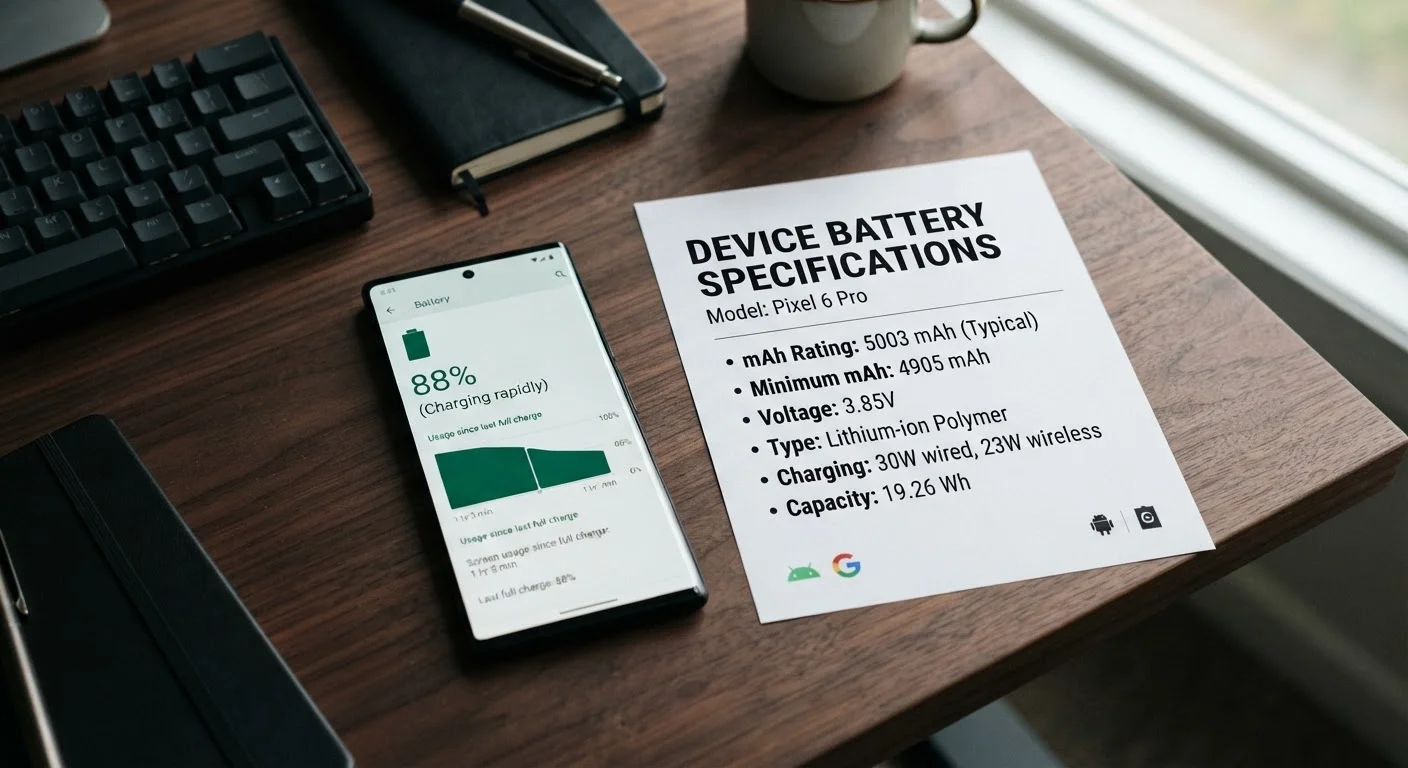
Photo credit: Telecom360.net | Connecting You To The Latest In Telecom
In this article
Two phones with identical mAh ratings can last very different amounts of time. Discover the hardware and software factors that determine real-world endurance.
Key Takeaways
- mAh measures stored charge, not how long a phone will last on a single charge.
- Processor efficiency is often the single biggest variable in real-world battery endurance.
- Display technology, resolution, and brightness have a large and measurable impact on drain.
- Software optimization - including OS scheduling and background processes - shapes endurance as much as hardware.
- Charging speed and cycle count affect long-term battery health, not just day-one performance.
What mAh Actually Measures
Milliampere-hours (mAh) quantifies how much electrical charge a battery can hold - not how that charge translates to screen time. Think of it like a fuel tank: a larger tank gives a vehicle more potential range, but fuel economy depends on the engine, the road, and driving habits. The same logic applies to smartphones.
Voltage matters too. Two cells with identical mAh ratings but different voltages store different amounts of total energy. Total energy is expressed in watt-hours (Wh = mAh × V ÷ 1,000). Because smartphone batteries typically operate around 3.7-3.85 V, the difference is small between similar devices - but it reinforces that mAh is an approximation, not a complete picture.
This is why comparing raw mAh figures across phone generations or across Android and iOS devices can be misleading. As battery capacity myths go, treating mAh as a direct proxy for endurance is one of the most persistent.
The Efficiency Variable: Processor Architecture
The chip inside a phone is the primary determinant of how quickly stored energy is consumed. Modern mobile processors are fabbed at increasingly small process nodes (measured in nanometers) - smaller nodes generally mean more transistors switching at lower voltages, which reduces power draw per computation.
A processor designed on a newer, smaller node can perform the same workload as an older chip while consuming significantly less power. This means a phone with a 4,500 mAh battery and an efficient chip can outlast a phone with a 5,000 mAh battery paired with an older, less efficient processor - a real-world outcome that spec sheets rarely make obvious.
~40%
Typical display share of total battery consumption
Industry teardown and power-profiling analyses consistently find the display accounts for roughly 30-40% of total power draw during active screen-on use.
500+
Charge cycles before significant capacity loss
Most lithium-ion smartphone batteries are rated to retain approximately 80% of original capacity after 500 full charge cycles, though real-world outcomes vary with temperature and charging behavior.
2-3×
Power efficiency difference across chip generations
Comparative power measurements show that processors built on newer process nodes can complete the same workloads using two to three times less energy than chips from two to three generations prior.
Integrated components matter as well. Modem efficiency - particularly 5G sub-6 GHz versus mmWave - affects how much power the radio draws during connectivity. An integrated modem sharing the same chip die tends to be more power-efficient than a discrete modem communicating across separate pathways.
Display Power Consumption: Resolution, Refresh Rate, and Technology
After the processor, the display is typically the second-largest power consumer during active use. Three variables drive screen drain: panel technology, resolution, and refresh rate.
Panel technology: OLED displays consume power proportional to pixel brightness - showing dark content uses noticeably less power than bright white interfaces. LCD panels backlight the entire screen regardless of content, making them less efficient for dark-mode-heavy use but more predictable in power draw.
Refresh rate: A 120 Hz display redraws the screen twice as often as a 60 Hz display. Without adaptive refresh rate technology - which dynamically lowers refresh rate during static content like reading - running at 120 Hz continuously adds meaningful drain. Adaptive refresh rate implementations vary in quality across devices and software versions.
Resolution: Higher pixel counts require the GPU to push more pixels, increasing processing overhead. The impact depends on how content is rendered and whether the display scales output intelligently.
Evaluate Endurance With Real-World Benchmarks
Rather than comparing mAh figures directly, look for independent battery endurance tests that measure screen-on time under consistent, real-world workloads - web browsing, video playback, and mixed-use scenarios. These tests control for brightness and connectivity variables, giving a far more reliable signal than capacity ratings alone.
Software, Background Processes, and OS Power Management
Hardware efficiency only tells part of the story. The operating system and apps running on top of it determine whether that efficiency is preserved or squandered. Background processes - push notifications, location polling, cloud sync - continuously draw small amounts of power that accumulate significantly over a full day.
OS-level power management varies meaningfully across platforms and versions. Scheduling algorithms that put idle cores to sleep quickly, aggressive app suspension policies, and well-tuned thermal governors all reduce baseline power draw. Poorly optimized apps or ones that resist system-imposed restrictions can cause disproportionate drain regardless of hardware quality.
It's worth noting that force-quitting apps is widely misunderstood as a power-saving technique. The evidence on this is more nuanced than most users expect - see misconceptions about closing apps to save battery for a detailed breakdown. Similarly, background app refresh and battery drain has a more complex relationship with endurance than commonly assumed.
Long-Term Health: Cycles, Heat, and Charging Speed
Battery capacity degrades over time. Lithium-ion chemistry loses its ability to hold a full charge with each discharge-recharge cycle and sustained exposure to heat. A phone that shipped with 5,000 mAh of usable capacity may deliver noticeably less after one to two years of heavy use - meaning day-one endurance benchmarks don't represent the phone's performance across its lifetime.
Fast charging, while convenient, introduces additional heat during the charging process. How manufacturers manage thermal load during fast charging affects how quickly capacity degrades. Some devices implement charging speed limits at high temperatures or cap charge at 80% by default to preserve long-term health.
Understanding these dynamics applies to other hardware specs too - just as raw RAM figures can be misleading, a headline mAh number captures none of the lifecycle nuance that determines a phone's practical value over years of ownership.
Frequently Asked Questions

Author
Smartphones Editorial Team
Smartphones Editorial Team is the collective byline for our editorial team and contributor network. Articles published under this byline or an editorial pen name are researched, written, and reviewed according to our editorial standards for clarity, consistency, and independence before publication.
View all articles →