
Signal Strength Indicators Explained: What Those Bars on Your Phone Actually Mean
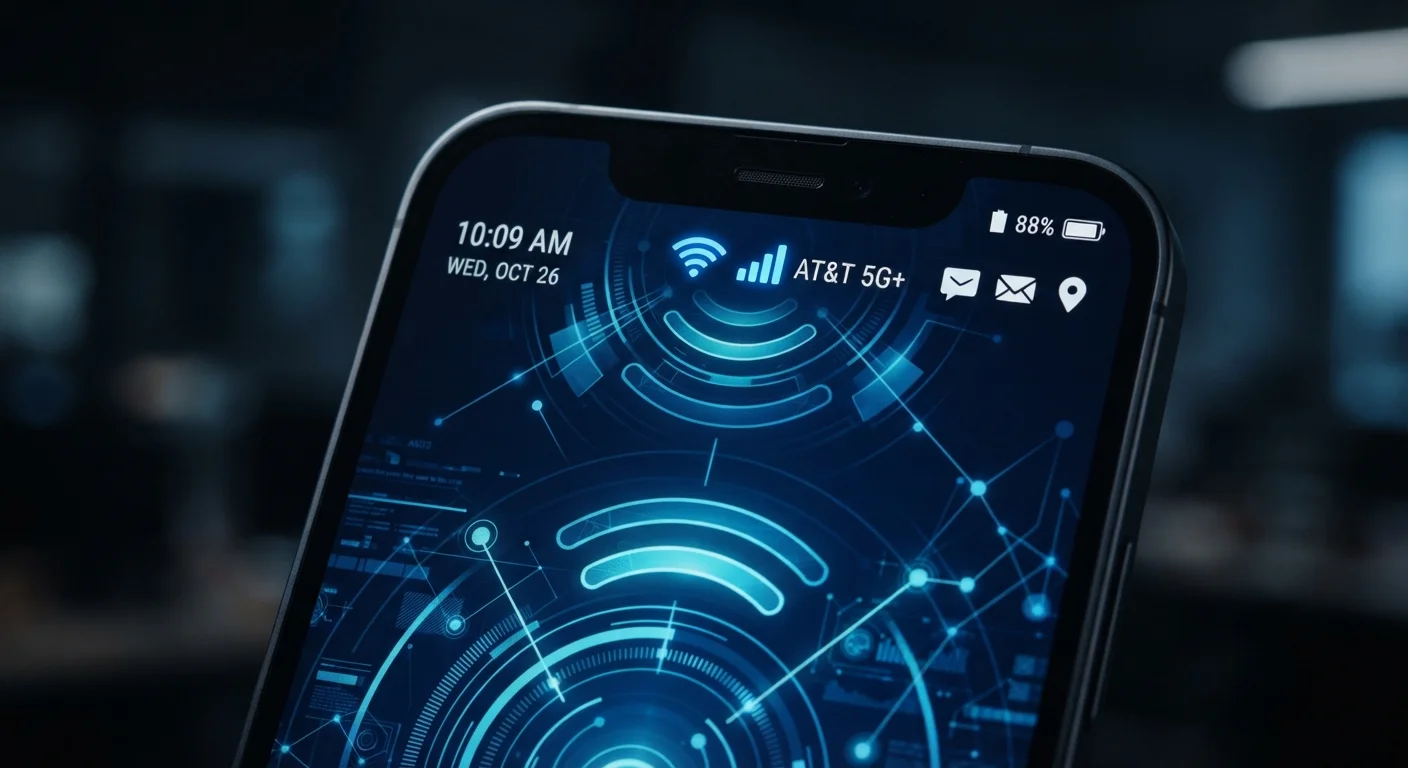
Photo credit: Telecom360.net | Connecting You To The Latest In Telecom
In this article
Signal bars are more symbolic than scientific. Understand what they actually measure, why they vary by device, and what to look for instead.
What Signal Bars Actually Represent
The signal bars on your phone are a visual shorthand, not a scientific measurement. They represent a carrier-defined interpretation of your device's received signal strength - typically derived from a metric called RSRP (Reference Signal Received Power), measured in decibels relative to one milliwatt (dBm). The actual dBm range for LTE generally spans from around −44 dBm (excellent) to −140 dBm (no signal), but your phone collapses that entire spectrum into three to five bars.
Critically, there is no industry-wide standard for how many dBm of signal maps to how many bars. Each device manufacturer and carrier sets its own thresholds. A phone showing four bars on one network may be receiving a weaker signal than a different phone showing three bars on another. This makes bars useful for quick glances, but misleading for any real comparison.
| Signal strength unit | dBm (decibels per milliwatt) |
| LTE signal range | −44 dBm (excellent) to −140 dBm (no signal) |
| Good LTE RSRP threshold | Above −80 dBm |
| Poor LTE RSRP threshold | Below −110 dBm |
| Industry bar standard | None - thresholds set per manufacturer |
| iOS field test mode | Dial *3001#12345#* to access raw signal data |
For a deeper look at how hardware shapes what your device can receive, see our breakdown of chip specs and real-world performance.
The Metrics That Actually Matter
If you need to diagnose a weak connection, skip the bars and look at the raw signal values your phone can display through its field test or engineering mode. Key metrics include:
- RSRP (Reference Signal Received Power): The most direct measure of signal strength in LTE and 5G NR networks. Values above −80 dBm are generally considered good; below −110 dBm indicates a poor connection.
- RSRQ (Reference Signal Received Quality): Accounts for interference and network congestion alongside signal strength. A strong RSRP with poor RSRQ often means a congested cell tower.
- SINR/SNR (Signal-to-Interference-plus-Noise Ratio): Indicates how cleanly your device can decode the signal from background noise. Higher values mean faster, more reliable data throughput.
RSRP
Reference Signal Received Power - the primary measure of LTE and 5G signal strength, expressed in dBm. It measures the average power of resource elements carrying the reference signal from a cell tower.
RSRQ
Reference Signal Received Quality - a ratio that factors in both signal strength and interference from neighboring cells. It provides a more complete picture of signal usability than RSRP alone.
SINR
Signal-to-Interference-plus-Noise Ratio - measures how clearly a device can distinguish the intended signal from background interference and noise. Higher SINR values correlate with faster and more stable data throughput.
dBm
Decibels relative to one milliwatt - the unit used to express signal power levels in cellular networks. Signal strength values are negative numbers; values closer to zero indicate a stronger signal.
VoLTE
Voice over LTE - a technology that routes phone calls over the 4G LTE data network rather than a separate voice channel, enabling higher call quality and simultaneous voice and data use.
mmWave
Millimeter wave - a high-frequency band of the radio spectrum (typically 24-100 GHz) used for high-speed 5G. It offers very fast speeds but has limited range and struggles to penetrate buildings.
On iOS, you can access raw signal data through the hidden field test mode (dialing *3001#12345#*). Android devices vary by manufacturer but often expose this under Settings > About Phone > SIM Status or through third-party apps. These numbers give you something bars simply cannot: reproducible, comparable data.
Understanding how frequency bands influence these metrics is equally important. Our reference guide to mobile band frequencies explains how low-, mid-, and high-band spectrum each behave differently indoors and at distance.
Why Bars Vary Between Devices - and Why That Matters
Two phones standing side by side can display entirely different bar counts even when connected to the same tower. This happens for several reasons:
- Manufacturer thresholds: Apple, Samsung, Google, and others each define their own dBm-to-bar mapping in firmware. These are rarely published and can change with software updates.
- Antenna design: Physical antenna placement and quality vary significantly across handsets. A compact device may sacrifice antenna efficiency for form factor. Our guide to reading smartphone spec sheets covers which hardware specs are commonly omitted from marketing materials.
- Supported bands: A phone that supports more frequency bands - particularly mid-band 5G - will maintain better apparent coverage in more locations. Bars reflect only the band currently in use, not the full capability of the modem.
- Software interpretation: Some carriers push software profiles that adjust how signal thresholds display on their locked devices, which can make coverage appear stronger than it is.
0
Industry standards governing bar-to-dBm mapping
No universal standard exists - each device manufacturer and carrier independently defines signal bar thresholds in their own firmware.
30 dBm
Typical signal range bars compress into a single level
On many devices, each bar can represent a swing of 20-30 dBm, masking meaningful differences in actual connection quality.
The practical takeaway: when comparing coverage between carriers or troubleshooting a dead zone, rely on carrier coverage maps, crowdsourced tools like the FCC's coverage viewer, or field test readings - not bar counts alone.
When Bars Fail You: Real-World Scenarios
There are common situations where signal bars actively mislead users:
- Full bars, no data: A congested tower can deliver strong RSRP but poor SINR, leaving you with four bars and unusably slow speeds during peak hours.
- Indoor signal drop: High-band 5G (mmWave) signals may show strong outdoor readings but struggle to penetrate walls. You can have bars at the window and none in the next room.
- Voice vs. data: On networks using VoLTE (Voice over LTE), voice calls and data share the same signal path. On older configurations, your phone may hold a voice connection while data degrades independently.
- Roaming indicators: When roaming onto a partner network, some phones do not distinguish roaming signal quality from home network quality in the bar display.
If your device seems sluggish even with adequate signal bars, the issue may be on the software side rather than the network. Our guide to software performance symptoms covers how to distinguish network throttling from device-level slowdowns.
This article is for informational purposes only. Signal metrics and device behaviors vary by carrier, region, and firmware version.

Author
Phone Plans Editorial Team
Phone Plans Editorial Team is the collective byline for our editorial team and contributor network. Articles published under this byline or an editorial pen name are researched, written, and reviewed according to our editorial standards for clarity, consistency, and independence before publication.
View all articles →