
Wearable Sensors Decoded: What Your Device Is Actually Measuring
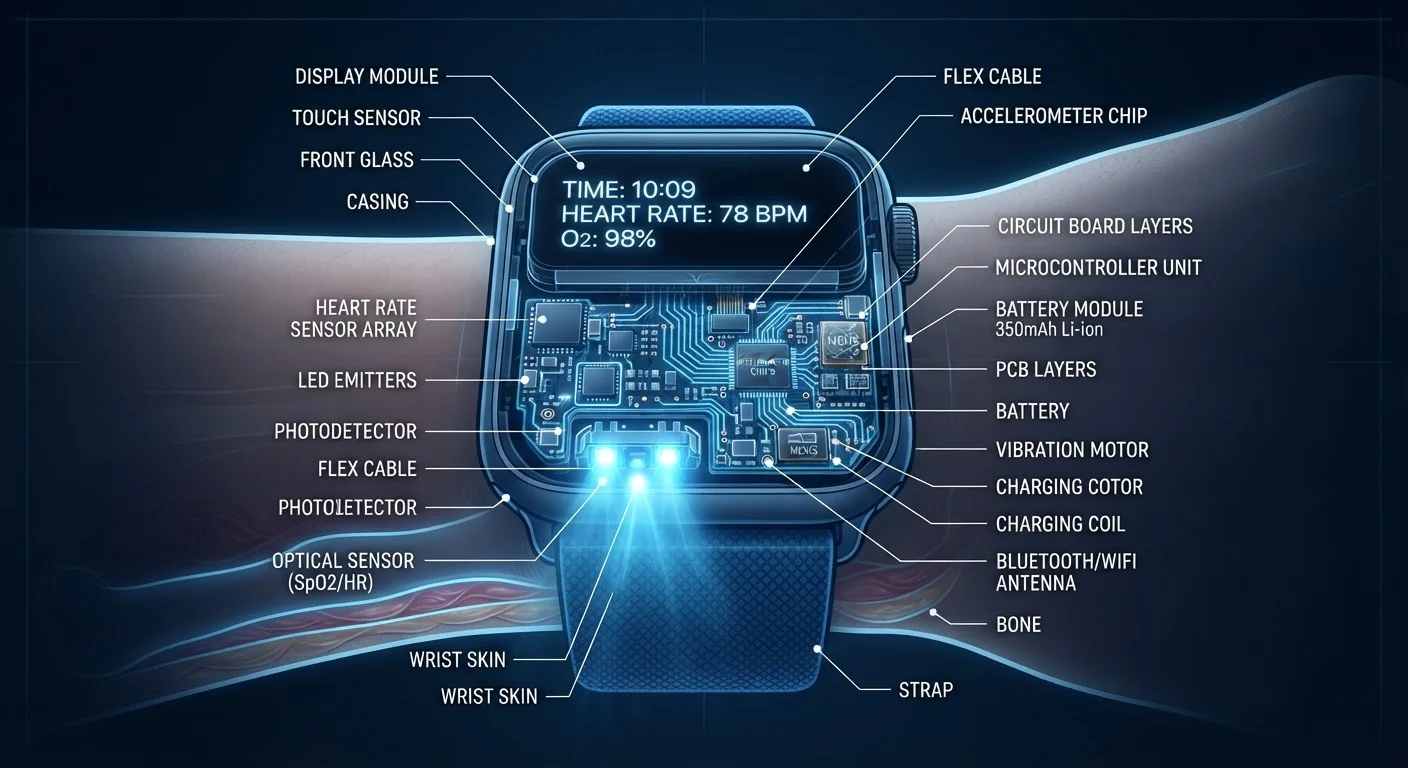
Photo credit: Telecom360.net | Connecting You To The Latest In Telecom
In this article
From PPG to accelerometers, learn what the sensors inside fitness trackers and smartwatches actually detect and how accurate they are.
Key Takeaways
- PPG (photoplethysmography) sensors use light pulses to infer heart rate and blood oxygen, not direct measurement.
- Accelerometers detect movement in three axes and are the foundation of step counting and activity classification.
- Sensor fusion combines multiple data streams to produce metrics like sleep stages, stress estimates, and VO2 max.
- Fit, skin tone, motion artifacts, and ambient light all influence raw sensor accuracy.
- No wearable sensor provides clinical-grade measurement without independent validation studies.
The Core Sensor Stack in a Modern Wearable
Most fitness trackers and smartwatches rely on a predictable set of sensor types, each engineered to detect a specific physical signal. Understanding what each one actually measures - rather than what the app claims to report - is the first step to interpreting your data critically.
Photoplethysmography (PPG): The optical heart rate sensor. Green LEDs (and sometimes red and infrared) pulse light into the skin while a photodetector measures reflected light intensity. Blood volume in the capillaries changes with each heartbeat, modulating that reflection. Software extracts the pulse frequency from this waveform. See the full breakdown of heart rate sensor accuracy for a deeper analysis of where this method succeeds and fails.
Accelerometer: A micro-electromechanical system (MEMS) chip that measures linear acceleration across three axes. It is the primary engine behind step counts, activity recognition, and movement intensity. A gyroscope - often paired with the accelerometer - measures rotational velocity, improving gesture detection and orientation tracking.
Bioelectrical sensors (ECG/EDA): Some devices include electrodes that measure electrical signals at the skin surface. Electrocardiogram (ECG) electrodes detect the heart's electrical pattern; electrodermal activity (EDA) sensors measure small changes in skin conductance linked to sweat gland activity, used as a proxy for physiological arousal.
3-5%
Typical PPG heart rate error margin at rest
Laboratory studies on consumer PPG sensors generally report mean absolute error rates in this range under controlled, low-motion conditions.
~15%
Step count error in daily use
Independent evaluations of consumer fitness trackers have found step count inaccuracies averaging around 10-20% depending on activity type and device placement.
2-4
Sensors typically fused for sleep staging
Most wearable sleep algorithms draw on accelerometer data, PPG-derived HRV, and in newer devices, skin temperature to classify sleep stages.
How Raw Signals Become Health Metrics
The gap between what a sensor physically detects and what gets displayed as a metric is bridged by algorithms - and that gap is substantial. Raw sensor output is noisy, context-free, and often ambiguous. Sensor fusion is how manufacturers manage this complexity.
Sleep stage classification illustrates this well. A wearable cannot directly observe brain activity, so it infers sleep stages by combining movement data (near-stillness suggests sleep), heart rate variability (HRV patterns shift across sleep stages), and sometimes skin temperature trends. The resulting labels - light, deep, REM - are probabilistic estimates, not confirmed measurements. Understanding how to get reliable sleep data requires knowing these limitations upfront.
Stress scores follow a similar logic. EDA and HRV are combined to infer sympathetic nervous system activation. This can flag physiological arousal during exercise, anxiety, or even caffeine intake - the sensor has no way to distinguish between them without additional context from the user.
“Consumer wearable sensors are best understood as estimators, not meters. They give you a statistically informed guess based on indirect physical signals - which is genuinely useful for tracking trends, but very different from a direct physiological measurement.”
— Digital Health Research Commentary, Peer-reviewed analysis of consumer biometric device accuracy
What Degrades Sensor Accuracy
Wearable sensors operate under practical constraints that affect data quality. The most common degrading factors:
- Motion artifacts: PPG signals are corrupted when the wrist moves, because the device shifts position relative to the skin. This is why heart rate readings during high-intensity interval training are less reliable than readings at rest.
- Fit and contact: A loose band reduces optical contact, introducing air gaps and ambient light interference. Most optical sensors require consistent skin pressure to function accurately.
- Skin tone and vascularity: Research has highlighted that melanin absorbs green light, which can reduce signal strength in people with darker skin tones when green-LED PPG sensors are used. Some manufacturers have added red and infrared wavelengths partly to address this.
- Environmental temperature: Cold conditions cause peripheral vasoconstriction, reducing blood flow to the wrist and weakening the PPG signal.
Before drawing conclusions from any wearable metric, a practical check of fit, wear position, and sensor conditions is worthwhile. The checklist for verifying wearable health metrics covers these systematically.
Wear Tighter Than Feels Natural
For optical sensors to work reliably, the device needs consistent skin contact throughout activity. Wearing the band one notch tighter than your resting comfort level - snug but not restrictive - meaningfully reduces motion artifact errors during exercise. Loosen it slightly during long passive wear periods to avoid circulation discomfort.
Interpreting What Your Data Actually Means
Consumer wearables are designed for trend monitoring, not clinical diagnosis. A single elevated resting heart rate reading means very little in isolation; a sustained upward trend over two weeks is more informative. The same principle applies to HRV, SpO2, and sleep efficiency scores.
Metrics like VO2 max estimates and calorie expenditure carry compounded uncertainty - they are derived values calculated from multiple imperfect inputs. Common misreadings of wearable fitness data explores exactly how these figures get misinterpreted in practice.
It is also worth noting that the hardware inside a device is only part of the picture. The algorithms processing sensor data, the calibration choices made by manufacturers, and the biometric profile a user provides all shape what gets reported. The full hardware anatomy of a smartwatch connects sensor capabilities to the broader component picture. And given how much raw biometric data these devices collect, understanding what wearable data gets collected and where it goes is an equally important part of informed ownership.
This article is for informational purposes only and does not constitute medical advice. Consult a qualified healthcare provider for any health-related concerns.
Frequently Asked Questions

Author
Consumer Electronics Editorial Team
Consumer Electronics Editorial Team is the collective byline for our editorial team and contributor network. Articles published under this byline or an editorial pen name are researched, written, and reviewed according to our editorial standards for clarity, consistency, and independence before publication.
View all articles →